Sunday, May 22, 2011

4.7) Energy Efficiency

Pyramid of Energy:

Only 10% of energy from each trophic level would be transferred to the next trophic level. For example, the grass has 100 kJ of energy, then it's eaten by cow, and the cow is eaten by a tiger. The cow would get only 10kJ from the grass, and the tiger would get only 1kJ from the original 100kJ. 
This is because energy can be lost through:
- Respiration (for movement, reproduction, digestion, etc.)
- Faeces - when the predator cannot digest certain substances of its prey, for example, a mouse cannot digest the cellulose of the plant and therefore would be lost in the form of waste or faeces.
-------> DEAD------> decomposers

4.6) Energy and Substances in Food Chain

Understand the transfer of substances and of energy along a food chain


Energy and substances in food chains are being transferred from producer to tertiary consumers.
Organic molecules: Carbohydrates (C, H, O), Proteins (C, H, O, N), Lipids (C, H, O)
C-H
C-O
C-C
O-H
C-N

These bonds represented ENERGY.
C,H,O,N are the substances in which we called them 'matters.'

4.5) Food chain, Food Web, and Pyramids

Understand the concepts of food chains, food webs, pyramids of number, pyramids of biomass and pyramids of energy transfer.


Food Chain - show the flow of matter & energy
linked together the relationship between producers and consumers:
producer --> primary consumers --> secondary consumers --> tertiary consumers ---> ...
- can only show one organism at each trophic level
- can't be sure if the organism is omnivore or feeding at 2 or more trophic levels


Food Web
Allow us a better understanding of the ecosystem, which, in this case of interaction, is feeding.
Food web is a combination of different food chains, showing different trophic leves:
- multiple preys
- multiple predators
- linked
eg) An organism can be secondary or tertiary consumer at the same time. 

Pyramids --> quantifying the food chain
1. Pyramid of Number - shows the number of organism at each trophic level (eg. counting)

                        -1 hawk-
                  ---10flycatcher---
       ---------100 carrotflies----------
------------1000 carrot plants--------------

problem: limitation in expression of energy

                            -1 hawk-
                    -----100 birds-----
     ----------------1000 bees--------------
                         -1 plant- 
                                   
(notice the tiny base... energy cannot be represented this way)

2.Pyramid of Biomass - shows the mass (of matter) contains at each trophic level
Because water content varies and took up a large percentage, we only calculate the amount of dry mass in biomass.
*measured in kg/area

3. Pyramid of Energy - shows the flow of energy, therefore it cannot be inverted

                         -1% consumer-
                   -----10% producers---                               *unit = energy = J/ kJ
------------------100% sunlight------------------                          = area = m2
                                                                                                = time = m/s/yr

(notice the decreasing amount of energy at 10% per trophic level)


4.4) Trophic Levels

Recall the names given to different trophic levels to include producers, primary, secondary and tertiary consumers and decomposers.


Trophic = feed 
photosynthesis --> herbivores (organisms which eat only plants) --> carnivores --> top carnivores


{producer (photosynthesis) --> primary consumer --> secondary consumer --> tertiary consumer} ---> DEAD ---> decomposers (fungi & bacteria) which 'recycle' the molecules, breaking down complex molecules into nitrates & phosphates)


Each level of consumer would convert the chemical energy of its prey into its own chemical energy.


Tuesday, May 10, 2011

4.3) Quadrats sample

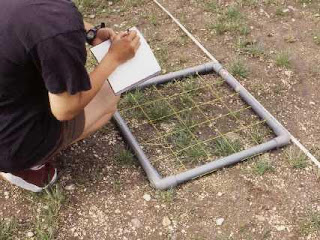
Quadrats sample means to use quadrats as sample to find out the distribution of a population in a certain habitat.

Quadrats sample must be...
- random (so no bias would be introduce)
- representative (large/ as close to the true number of population as possible) the bigger the number the better... about 10% of the actual field area would be appropriate

How to make a quadrat sample?
- Set up a grid system across the field (which work like the x, y coordinate on graph)
- Select random numbers (generated online or from the talbe) that gives the (x,y) coordinate so you'll know where to place your quadrats
- Calculate the area of your quadrat, then count the number of organism in it

Recording your data...
- Make a table (right column = number of quadrats, left coloum = number of organism found in the quadrat)
- Find the mean (average). This would give you the number of organism per square metre.

What can you do with the sample collected by quadrating?
- Calculate the estimate number of organisms in an ecosystem or given field
- Compare the number of a populations between two different areas

4.2) Quadrats


Quadrats: estimate the population size to two areas

A single ecosystem can be divided into two parts by a fence, etc. resulting in the difference of number of organisms between the grazed and ungrazed.

Quadrating are based on square grids, formed by any materials such as woods and metals, to isolate a sample.
The square is like a sample to the area. To find the overall estimate, count the number of species inside each square (repeat it several times) and find the mean of the whole ecosystem.
The square size of quadrats can range from 0.25-1 metre.


4.1) Ecosystems


now let's go step by step...
Ecosystem - rainforest

Community - animals
Population - Parrot